Introduction to Statistical Analysis
Statistics form the backbone of data-driven decision making in every field, from business analytics to scientific research. At its core, statistical analysis serves two primary purposes: describing what has happened in our data and making informed predictions about what might happen in the future.
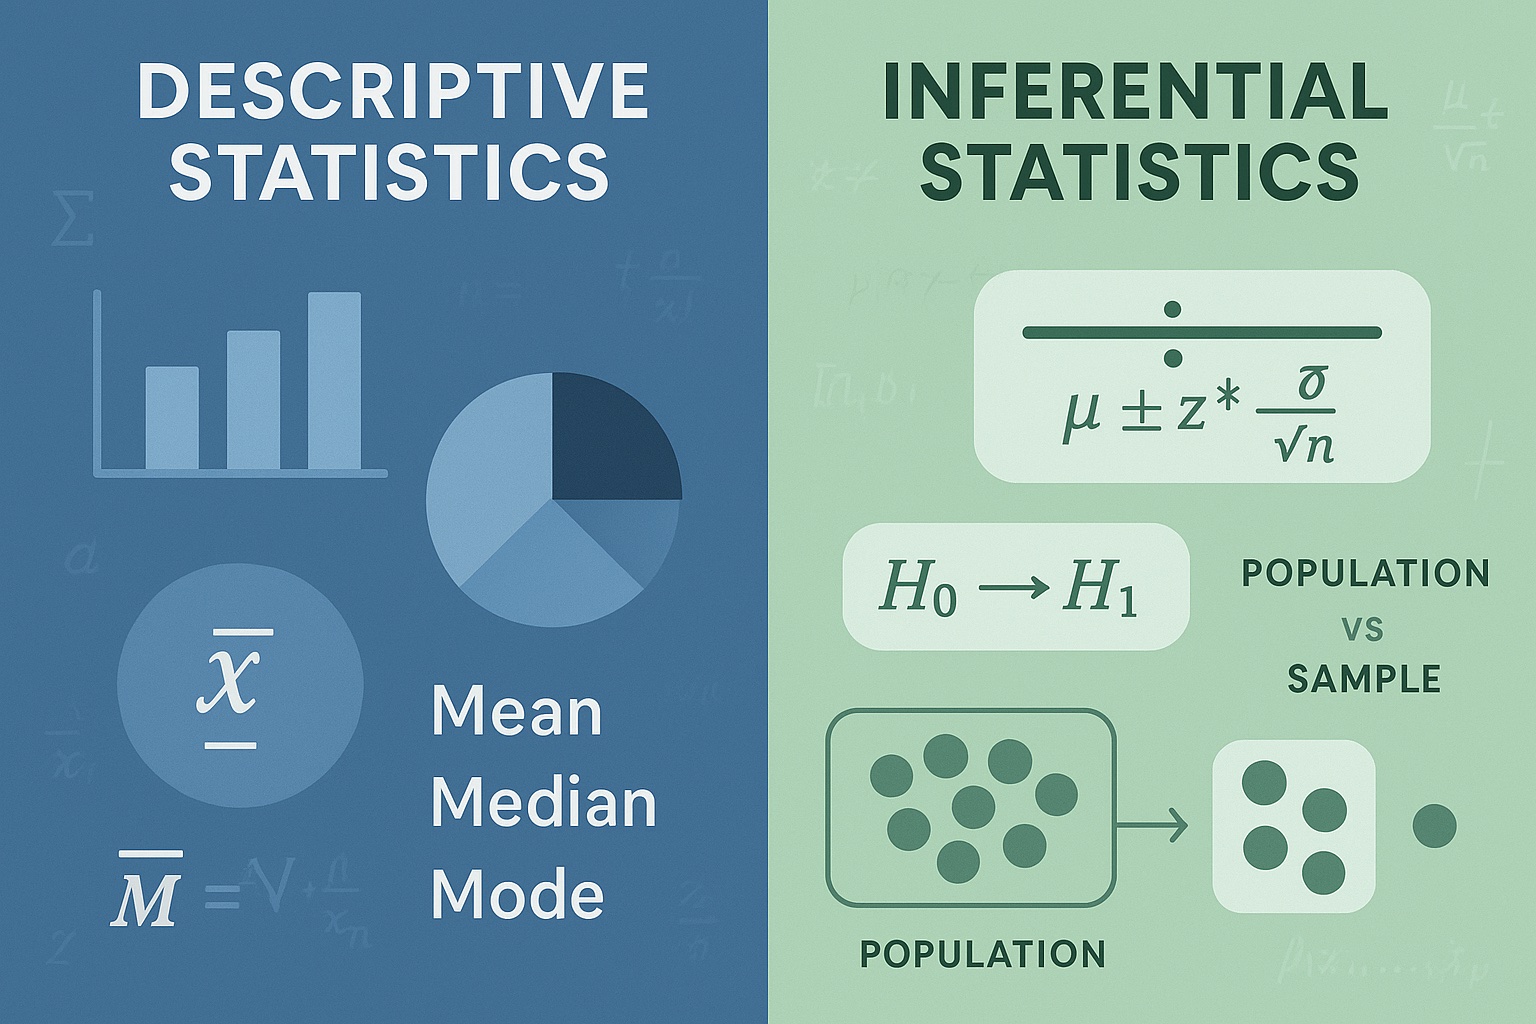
The field of statistics is broadly divided into two main branches: descriptive statistics and inferential statistics. Each serves a distinct purpose and employs different methodologies to extract meaningful insights from data. Understanding when and how to use each type is essential for anyone working with data, whether you’re a business analyst, researcher, student, or data science professional.
This comprehensive guide will explore both types of statistics, their applications, differences, and provide practical examples to help you master these fundamental concepts. By the end of this article, you’ll have a clear understanding of how to apply the right statistical approach to your specific data analysis needs.
What Are Descriptive Statistics?
Descriptive statistics are mathematical techniques used to summarize, organize, and describe the main characteristics of a dataset. They provide a snapshot of your data without making any inferences about a larger population. Think of descriptive statistics as the “what happened” portion of data analysis.
Key Components of Descriptive Statistics
Measures of Central Tendency
These statistics identify the center or typical value in your dataset:
- Mean (Average): The sum of all values divided by the number of observations
- Median: The middle value when data is arranged in order
- Mode: The most frequently occurring value in the dataset
Measures of Variability (Spread)
These statistics describe how spread out your data points are:
- Range: The difference between the highest and lowest values
- Variance: The average of squared differences from the mean
- Standard Deviation: The square root of variance, indicating typical deviation from the mean
- Interquartile Range (IQR): The range between the 25th and 75th percentiles
Measures of Shape
These describe the distribution pattern of your data:
- Skewness: Indicates whether data is symmetrically distributed or leans toward one side
- Kurtosis: Measures the “tailedness” of the distribution
Types of Descriptive Statistics
Univariate Analysis
This involves analyzing one variable at a time. For example, examining the average age of customers in your database or the distribution of test scores in a classroom.
Bivariate Analysis
This examines the relationship between two variables, such as the correlation between advertising spend and sales revenue.
Multivariate Analysis
This considers multiple variables simultaneously to understand complex relationships within your data.
Practical Examples of Descriptive Statistics
Consider a retail company analyzing customer purchase behavior:
- Mean purchase amount: $87.50 per transaction
- Median purchase amount: $65.00 (indicating some high-value outliers)
- Standard deviation: $45.20 (showing significant variation in purchase amounts)
- Most common purchase category: Electronics (mode)
These descriptive statistics provide immediate insights into customer behavior patterns without making predictions about future purchases.
What Are Inferential Statistics?
Inferential statistics use sample data to make educated guesses, predictions, or inferences about a larger population. Unlike descriptive statistics that describe what you observe, inferential statistics help you draw conclusions that extend beyond your immediate data.
Core Concepts in Inferential Statistics
Population vs. Sample
- Population: The entire group you want to study (e.g., all customers worldwide)
- Sample: A subset of the population that you actually observe (e.g., 1,000 customers from your database)
Sampling Distribution
The theoretical distribution of a statistic (like the mean) if you repeated your sampling process many times.
Statistical Inference
The process of using sample data to make conclusions about population parameters.
Key Methods in Inferential Statistics
Hypothesis Testing
This involves testing assumptions about population parameters:
- Null Hypothesis (H₀): The assumption that there’s no effect or difference
- Alternative Hypothesis (H₁): The assumption that there is an effect or difference
- P-value: The probability of obtaining your observed results if the null hypothesis is true
- Significance Level (α): The threshold for determining statistical significance (commonly 0.05)
Confidence Intervals
These provide a range of values within which the true population parameter likely falls. For example, “We are 95% confident that the true average customer satisfaction score is between 7.2 and 8.1.”
Regression Analysis
This technique examines relationships between variables and can predict outcomes:
- Simple Linear Regression: Predicts one variable based on another
- Multiple Regression: Predicts an outcome based on multiple variables
Analysis of Variance (ANOVA)
This tests whether there are significant differences between group means.
Types of Inferential Statistics
Parametric Tests
These assume your data follows a specific distribution (usually normal):
- T-tests for comparing means
- ANOVA for comparing multiple groups
- Pearson correlation for linear relationships
Non-parametric Tests
These don’t assume a specific distribution:
- Mann-Whitney U test
- Kruskal-Wallis test
- Spearman correlation
Practical Examples of Inferential Statistics
Using the same retail company example:
- Hypothesis Test: “Is there a significant difference in purchase amounts between male and female customers?”
- Confidence Interval: “We are 95% confident that the true average purchase amount for all customers is between $82.30 and $92.70.”
- Regression Analysis: “For every $1 increase in advertising spend, we predict a $3.50 increase in monthly sales.”
Key Differences Between Descriptive and Inferential Statistics
Understanding the distinctions between these two branches of statistics is crucial for proper application in data analysis.
Purpose and Scope
Descriptive Statistics
- Purpose: Summarize and describe observed data
- Scope: Limited to the data you have collected
- Focus: What happened in your sample
Inferential Statistics
- Purpose: Make predictions and generalizations about populations
- Scope: Extends beyond your sample to make broader conclusions
- Focus: What might be true about the larger population
Data Requirements
Descriptive Statistics
- Can work with any dataset, regardless of how it was collected
- No assumptions about sampling methods
- Works with both samples and populations
Inferential Statistics
- Requires representative sampling from the population
- Assumptions about data distribution and sampling methods
- Primarily works with sample data to infer population characteristics
Complexity and Interpretation
Descriptive Statistics
- Generally straightforward calculations
- Results are directly interpretable
- No probability statements involved
Inferential Statistics
- More complex statistical procedures
- Results require careful interpretation
- Involves probability and uncertainty
Risk and Limitations
Descriptive Statistics
- Lower risk of error in interpretation
- Limited by the scope of available data
- Cannot make predictions beyond the dataset
Inferential Statistics
- Higher risk of error due to sampling variability
- Subject to Type I and Type II errors
- Allows for broader applications but with uncertainty
When to Use Each Type
Choosing between descriptive and inferential statistics depends on your research objectives, data characteristics, and the questions you’re trying to answer.
Use Descriptive Statistics When:
Summarizing Data
When you need to present a clear overview of your dataset’s characteristics, such as creating executive summaries or data reports.
Exploring Data
During the initial stages of data analysis to understand patterns, identify outliers, and assess data quality.
Comparing Groups Within Your Sample
When you want to compare different segments of your existing data without making broader generalizations.
Creating Visualizations
When developing charts, graphs, and dashboards to communicate findings to stakeholders.
Quality Control
When monitoring processes and ensuring data meets specified standards.
Use Inferential Statistics When:
Making Predictions
When you need to forecast future trends or outcomes based on historical data.
Testing Hypotheses
When you have specific assumptions about relationships or differences that need scientific validation.
Generalizing to Populations
When your sample represents a larger group and you want to make broader conclusions.
Establishing Cause and Effect
When you need to determine whether changes in one variable cause changes in another.
Making Business Decisions
When you need statistical evidence to support strategic choices with financial implications.
Real-World Applications
Understanding how these statistical methods apply in various fields helps illustrate their practical importance.
Business and Marketing
Descriptive Statistics Applications:
- Customer segmentation analysis
- Sales performance reporting
- Website traffic analysis
- Employee satisfaction surveys
Inferential Statistics Applications:
- Market research and consumer behavior prediction
- A/B testing for website optimization
- Sales forecasting models
- Customer lifetime value prediction
Healthcare and Medicine
Descriptive Statistics Applications:
- Patient demographic analysis
- Disease prevalence reporting
- Treatment outcome summaries
- Hospital performance metrics
Inferential Statistics Applications:
- Clinical trial effectiveness testing
- Disease risk factor identification
- Treatment comparison studies
- Epidemiological research
Education and Research
Descriptive Statistics Applications:
- Student performance analysis
- Curriculum effectiveness evaluation
- Resource allocation reporting
- Institutional benchmarking
Inferential Statistics Applications:
- Educational intervention effectiveness
- Standardized test score prediction
- Learning outcome assessment
- Research hypothesis testing
Technology and Data Science
Descriptive Statistics Applications:
- System performance monitoring
- User behavior analysis
- Data quality assessment
- Feature engineering
Inferential Statistics Applications:
- Machine learning model validation
- Predictive analytics
- Statistical significance testing
- Confidence interval estimation
Common Mistakes to Avoid
Both novice and experienced analysts can fall into statistical traps that lead to incorrect conclusions.
Descriptive Statistics Mistakes
Over-reliance on Means
Using only the mean to describe data can be misleading, especially with skewed distributions. Always consider median and mode alongside the mean.
Ignoring Data Distribution
Failing to examine the shape of your data distribution can lead to inappropriate statistical choices and misinterpretation of results.
Correlation vs. Causation
Descriptive statistics can show relationships between variables, but they cannot establish causation without proper experimental design.
Inferential Statistics Mistakes
Inadequate Sample Size
Using samples that are too small can lead to unreliable results and failed hypothesis tests.
Assumption Violations
Many inferential tests require specific assumptions about data distribution. Violating these assumptions can invalidate your conclusions.
P-Hacking
Manipulating data or analysis methods to achieve statistically significant results is a serious ethical violation that undermines scientific integrity.
Misinterpreting Confidence Intervals
A 95% confidence interval doesn’t mean there’s a 95% chance the true value lies within the interval for a specific sample.
Generalizing Beyond Sample Scope
Making inferences about populations that differ significantly from your sample characteristics.
Best Practices for Both Types
Data Quality Assessment
Always examine your data for completeness, accuracy, and consistency before conducting any statistical analysis.
Appropriate Method Selection
Choose statistical methods that match your data type, distribution, and research objectives.
Clear Communication
Present results in a way that’s understandable to your audience, avoiding unnecessary jargon while maintaining accuracy.
Validation and Verification
Cross-check your results using alternative methods when possible, and seek peer review for important analyses.
Advanced Considerations and Modern Applications
Integration of Both Approaches
In practice, descriptive and inferential statistics often work together in comprehensive data analysis projects. A typical workflow might involve:
- Exploratory Data Analysis (EDA) using descriptive statistics to understand data characteristics
- Hypothesis Formation based on descriptive insights
- Statistical Testing using inferential methods to validate hypotheses
- Results Interpretation combining both approaches for comprehensive understanding
Technology and Statistical Software
Modern statistical software packages like R, Python, SPSS, and SAS have made complex statistical analyses more accessible. However, understanding the underlying principles remains crucial for proper application and interpretation.
Big Data Considerations
With the advent of big data, traditional statistical approaches face new challenges:
- Computational Complexity: Large datasets require efficient algorithms
- Statistical Significance vs. Practical Significance: With massive samples, even tiny differences can be statistically significant
- Data Quality Issues: Larger datasets often contain more noise and missing values
Conclusion
The distinction between descriptive and inferential statistics represents a fundamental divide in how we approach data analysis. Descriptive statistics provide the foundation for understanding what our data tells us about the specific observations we have collected. They offer clear, interpretable summaries that help us identify patterns, trends, and characteristics within our datasets.
Inferential statistics, on the other hand, allow us to extend our understanding beyond our immediate data to make educated predictions and generalizations about larger populations. This capability is essential for scientific research, business decision-making, and policy development.
The key to successful statistical analysis lies not in choosing one approach over the other, but in understanding when and how to apply each method appropriately. Descriptive statistics should typically precede inferential analysis, providing the groundwork for hypothesis formation and method selection. Together, they form a comprehensive toolkit for extracting meaningful insights from data.
As data continues to grow in volume and importance across all sectors, the ability to effectively use both descriptive and inferential statistics becomes increasingly valuable. Whether you’re analyzing customer behavior, conducting scientific research, or making strategic business decisions, mastering these statistical fundamentals will enhance your ability to turn raw data into actionable insights.
Remember that statistical analysis is both an art and a science. While the mathematical foundations provide rigor and reliability, the interpretation and application of results require judgment, experience, and deep understanding of the context in which the analysis is conducted. By combining technical proficiency with critical thinking, you can harness the full power of statistical analysis to drive informed decision-making and advance knowledge in your field.
The journey of learning statistics is ongoing, as new methods and technologies continue to evolve. However, the fundamental principles of descriptive and inferential statistics remain constant, providing a solid foundation for more advanced statistical techniques and emerging fields like machine learning and artificial intelligence. For a related read, see How to Read Statistical Charts and Graphs.