Introduction
Standard deviation is one of the most fundamental concepts in statistics, serving as a crucial measure of data variability. Whether you’re a student tackling your first statistics course, a researcher analyzing experimental data, or a business professional interpreting market trends, understanding how to calculate standard deviation is essential for making informed decisions based on data.
This comprehensive guide will walk you through every aspect of standard deviation calculation, from basic concepts to advanced applications. By the end of this tutorial, you’ll have the confidence to calculate standard deviation manually, understand its practical significance, and apply it effectively in real-world scenarios.
What is Standard Deviation?
Standard deviation is a statistical measure that quantifies the amount of variation or dispersion in a dataset. In simpler terms, it tells us how spread out the data points are from the average (mean) value. A smaller standard deviation indicates that data points are clustered closely around the mean, while a larger standard deviation suggests greater variability.
Think of standard deviation as a measure of consistency. For example, if two basketball players both average 20 points per game, but Player A has a standard deviation of 2 points while Player B has a standard deviation of 8 points, Player A is more consistent in their scoring performance.
Key Characteristics of Standard Deviation:
- Always positive: Standard deviation cannot be negative
- Same units as the data: If measuring height in inches, standard deviation is also in inches
- Sensitive to outliers: Extreme values can significantly affect the standard deviation
- Zero indicates no variation: All data points are identical
Understanding the Standard Deviation Formula
The standard deviation formula varies slightly depending on whether you’re working with a population or a sample. Understanding this distinction is crucial for accurate calculations.
Population Standard Deviation (σ)
When you have data for an entire population, use this formula:
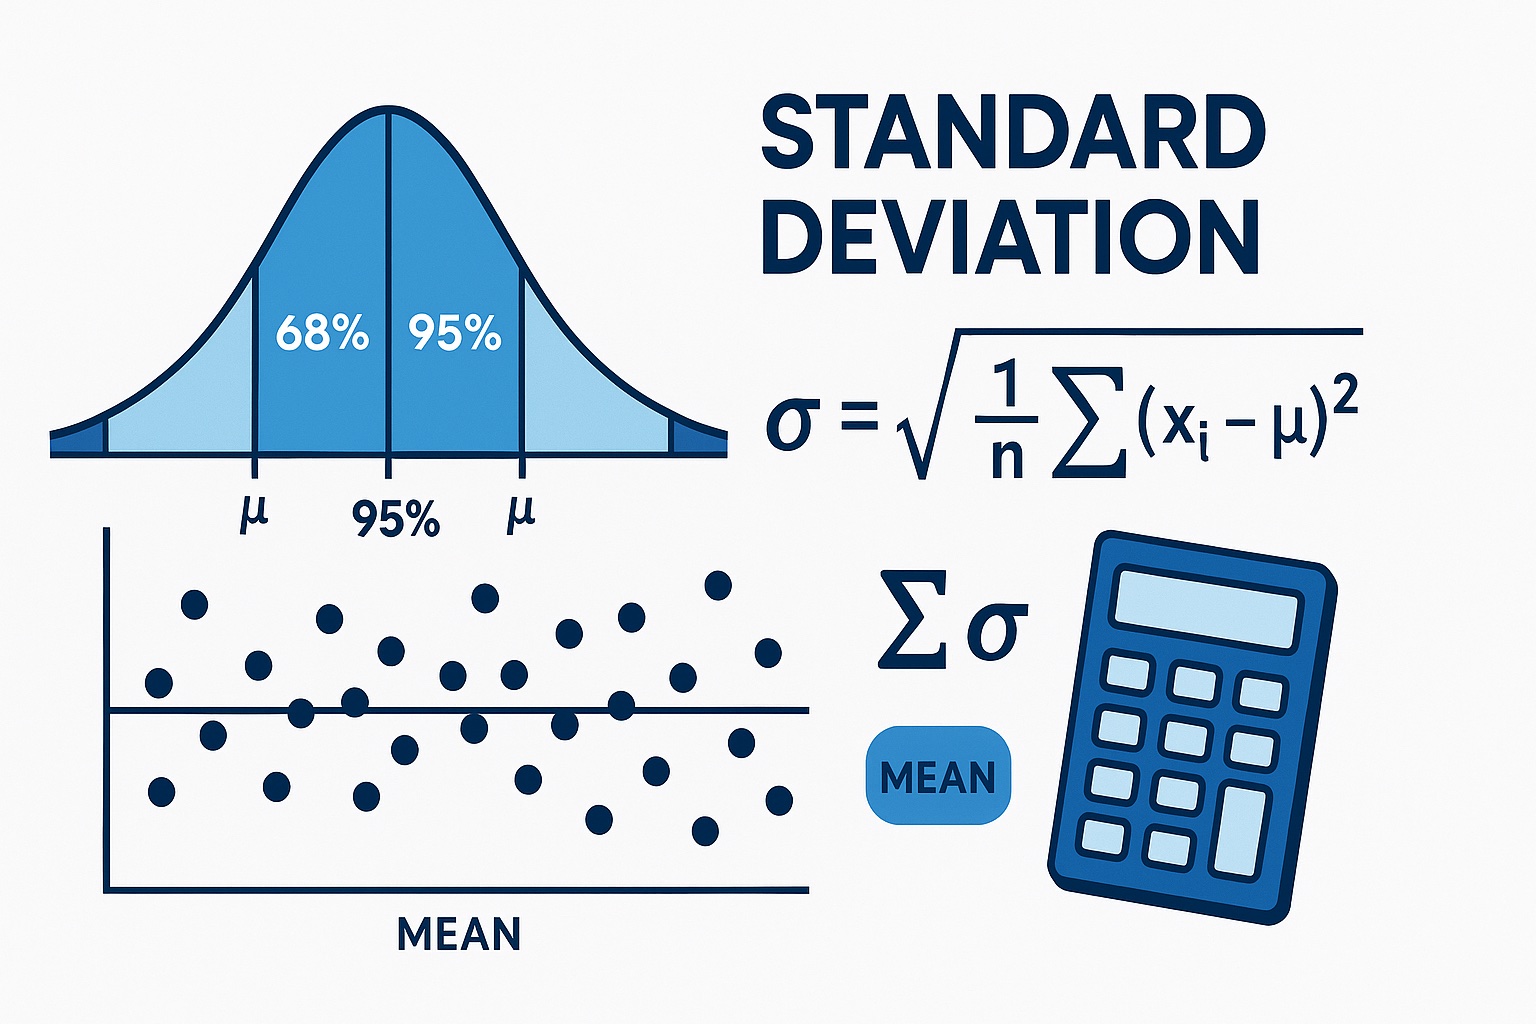
σ = √[Σ(xi – μ)² / N]
Where:
- σ (sigma) = population standard deviation
- xi = each individual value
- μ (mu) = population mean
- N = total number of values in the population
- Σ = sum of all values
Sample Standard Deviation (s)
When working with a sample from a larger population, use this formula:
s = √[Σ(xi – x̄)² / (n-1)]
Where:
- s = sample standard deviation
- xi = each individual value
- x̄ = sample mean
- n = number of values in the sample
- (n-1) = degrees of freedom
The key difference is that sample standard deviation divides by (n-1) instead of n, known as Bessel’s correction. This adjustment provides an unbiased estimate of the population standard deviation.
Step-by-Step Calculation Guide
Let’s work through a detailed example to demonstrate the calculation process. We’ll calculate the standard deviation for a sample dataset representing test scores: 85, 90, 78, 92, 88, 76, 95, 82, 89, 91.
Step 1: Calculate the Sample Mean (x̄)
Add all values and divide by the number of observations:
x̄ = (85 + 90 + 78 + 92 + 88 + 76 + 95 + 82 + 89 + 91) ÷ 10
x̄ = 866 ÷ 10 = 86.6
Step 2: Calculate Deviations from the Mean
For each data point, subtract the mean:
- 85 – 86.6 = -1.6
- 90 – 86.6 = 3.4
- 78 – 86.6 = -8.6
- 92 – 86.6 = 5.4
- 88 – 86.6 = 1.4
- 76 – 86.6 = -10.6
- 95 – 86.6 = 8.4
- 82 – 86.6 = -4.6
- 89 – 86.6 = 2.4
- 91 – 86.6 = 4.4
Step 3: Square Each Deviation
Square each deviation to eliminate negative values:
- (-1.6)² = 2.56
- (3.4)² = 11.56
- (-8.6)² = 73.96
- (5.4)² = 29.16
- (1.4)² = 1.96
- (-10.6)² = 112.36
- (8.4)² = 70.56
- (-4.6)² = 21.16
- (2.4)² = 5.76
- (4.4)² = 19.36
Step 4: Sum the Squared Deviations
Add all squared deviations:
Σ(xi – x̄)² = 2.56 + 11.56 + 73.96 + 29.16 + 1.96 + 112.36 + 70.56 + 21.16 + 5.76 + 19.36 = 348.4
Step 5: Divide by Degrees of Freedom
For a sample, divide by (n-1):
348.4 ÷ (10-1) = 348.4 ÷ 9 = 38.71
Step 6: Take the Square Root
s = √38.71 = 6.22
The sample standard deviation is 6.22 points.
Practical Applications and Examples
Example 1: Quality Control in Manufacturing
A manufacturing company produces bolts with a target diameter of 10mm. Quality control measures 20 bolts and finds a standard deviation of 0.05mm. This low standard deviation indicates consistent production quality, as most bolts fall within a narrow range around the target.
Example 2: Investment Analysis
Two investment portfolios both return 8% annually on average, but Portfolio A has a standard deviation of 3% while Portfolio B has 12%. Portfolio A offers more predictable returns, making it suitable for risk-averse investors.
Example 3: Academic Performance
A teacher compares two classes: Class A has test scores with a mean of 82 and standard deviation of 5, while Class B has a mean of 82 and standard deviation of 15. Class A shows more consistent performance, suggesting effective teaching methods.
Common Mistakes to Avoid
Mistake 1: Confusing Population and Sample Formulas
Using the wrong formula leads to incorrect results. Always verify whether you’re working with a complete population or a sample.
Mistake 2: Forgetting to Square Root
The variance (before taking the square root) is useful, but remember that standard deviation requires the final square root step.
Mistake 3: Mishandling Negative Deviations
Never ignore the squaring step, as it’s essential for handling negative deviations correctly.
Mistake 4: Rounding Too Early
Maintain precision throughout calculations and round only the final result to avoid cumulative errors.
Advanced Concepts and Variations
Weighted Standard Deviation
When data points have different levels of importance, use weighted standard deviation:
s = √[Σwi(xi – x̄)² / Σwi]
Where wi represents the weight of each data point.
Coefficient of Variation
The coefficient of variation (CV) expresses standard deviation as a percentage of the mean:
CV = (s / x̄) × 100
This measure is useful for comparing variability across datasets with different units or scales.
Empirical Rule (68-95-99.7 Rule)
For normally distributed data:
- 68% of data falls within 1 standard deviation of the mean
- 95% falls within 2 standard deviations
- 99.7% falls within 3 standard deviations
Using Technology for Calculations
Excel Functions
- STDEV.S(): Sample standard deviation
- STDEV.P(): Population standard deviation
Statistical Software
Popular options include SPSS, R, Python (NumPy, SciPy), and specialized calculators for quick computations.
Online Calculators
While useful for verification, understanding manual calculation ensures deeper comprehension of the concept.
Interpreting Standard Deviation Results
Small Standard Deviation (< 10% of mean)
Indicates high consistency and predictability in the data. Suitable for situations requiring reliability.
Medium Standard Deviation (10-30% of mean)
Shows moderate variation, common in many real-world scenarios. Requires careful interpretation based on context.
Large Standard Deviation (> 30% of mean)
Suggests high variability and less predictability. May indicate diverse conditions or measurement errors.
Real-World Decision Making
Business Applications
- Risk Assessment: Evaluate investment volatility
- Quality Control: Monitor production consistency
- Performance Metrics: Assess employee or process reliability
Research Applications
- Experimental Design: Determine sample sizes needed
- Data Analysis: Identify outliers and data quality issues
- Hypothesis Testing: Calculate confidence intervals
Educational Applications
- Grade Analysis: Understand class performance distribution
- Standardized Testing: Compare student performance across different scales
- Curriculum Evaluation: Assess teaching effectiveness
Conclusion
Mastering standard deviation calculation is fundamental to statistical literacy and data-driven decision making. This comprehensive guide has provided you with the theoretical foundation, practical calculation methods, and real-world applications necessary to confidently work with standard deviation in various contexts.
Remember that standard deviation is not just a mathematical exercise—it’s a powerful tool for understanding variability, making predictions, and assessing risk. Whether you’re analyzing business performance, conducting research, or making personal financial decisions, standard deviation provides valuable insights into data patterns and reliability.
Practice with different datasets, explore various applications, and gradually build your confidence in interpreting standard deviation results. With consistent application, you’ll develop the intuition needed to leverage this essential statistical measure effectively in your academic, professional, and personal endeavors.
The journey to statistical proficiency begins with understanding fundamental concepts like standard deviation. Use this guide as a reference, continue practicing with real data, and don’t hesitate to explore advanced statistical concepts as your confidence grows. Statistical thinking is a valuable skill that will serve you well in our increasingly data-driven world. See also our guide to Business Statistics.