An in-depth guide to creating your own interactive geometry calculator using JavaScript, complete with area calculations for simple and complex polygons.
Introduction: Why Build a Geometry Calculator?
Geometry calculations form the foundation of numerous real-world applications—from land surveying and architecture to game development and geographic information systems. As developers, we often need reliable tools to calculate the areas of various shapes. While there are many online calculators available, building your own offers several advantages:
- Complete customization to fit your specific project requirements
- Integration flexibility with your existing web applications
- Learning opportunity to understand coordinate geometry and algorithmic thinking
- Portfolio enhancement to showcase your JavaScript skills
In this comprehensive tutorial, we'll walk through the process of building a powerful, interactive geometry area calculator using JavaScript. By the end, you'll have a fully functional web application that accurately calculates the area of both simple and complex polygons using coordinate geometry.
What We'll Build
Our geometry calculator will:
- Allow users to input polygon coordinates through an intuitive interface
- Calculate areas for both regular and irregular polygons
- Support multiple measurement units
- Visualize the shapes using HTML Canvas
- Provide clear, accurate results with proper rounding
- Work across all major browsers and devices
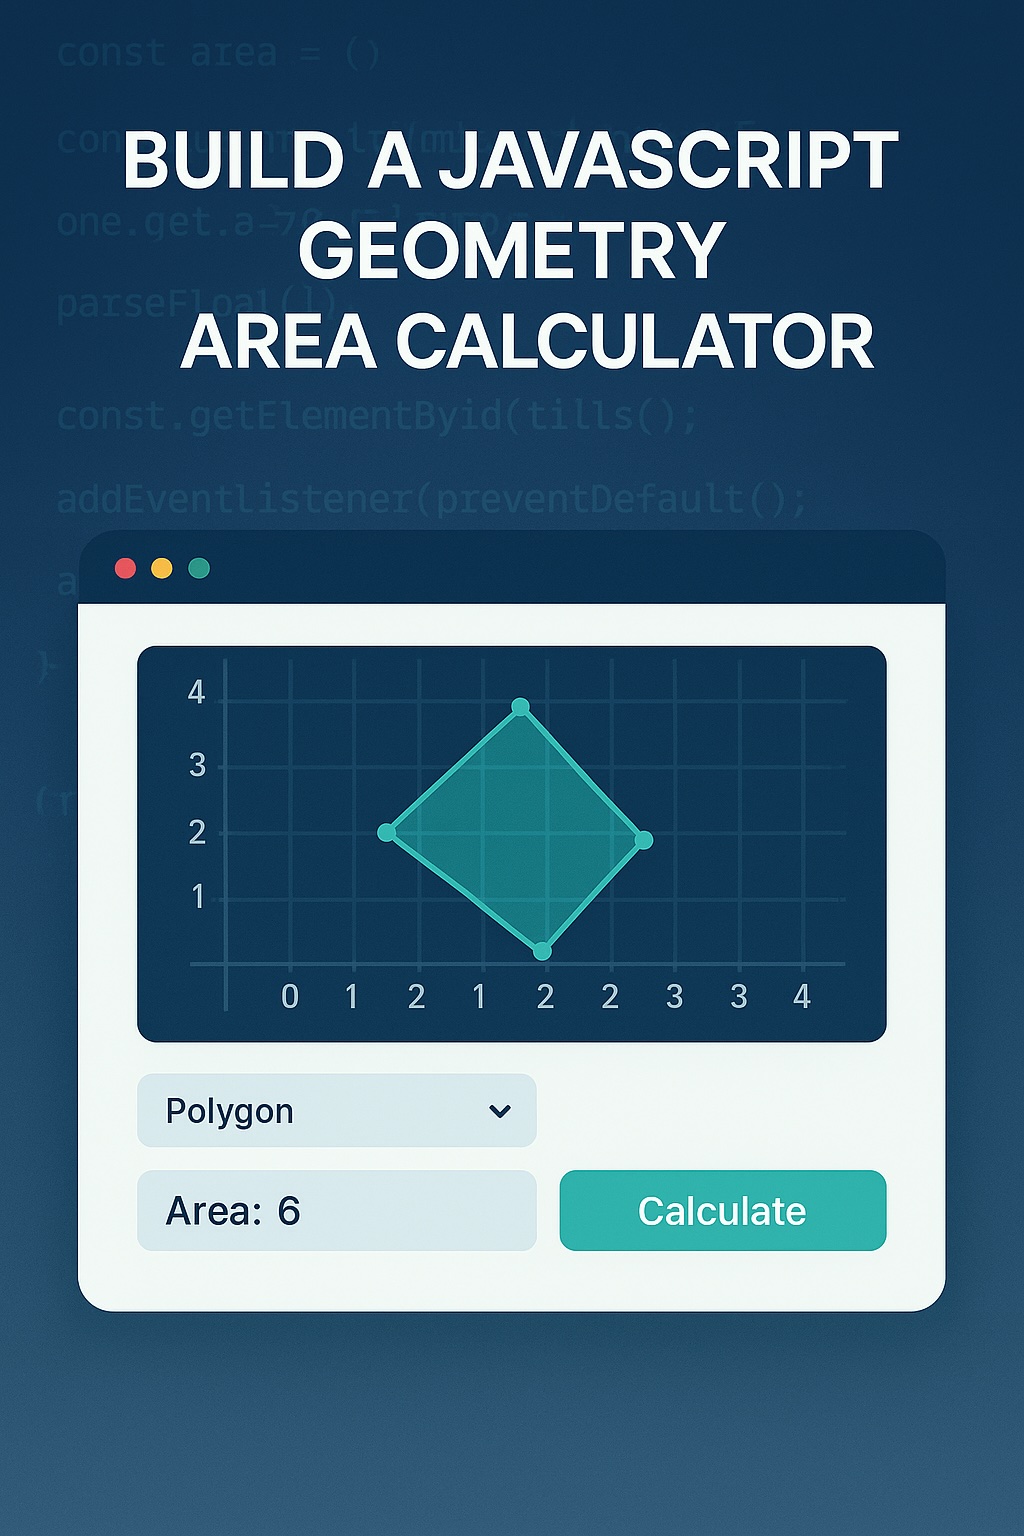
A preview of our final JavaScript Geometry Area Calculator with interactive polygon input
Prerequisites
To follow along with this tutorial, you should have:
- Basic understanding of HTML, CSS, and JavaScript
- Familiarity with DOM manipulation
- Text editor or IDE (VS Code, Sublime Text, etc.)
- Modern web browser
- Optional: Understanding of coordinate geometry basics
Understanding the Mathematics Behind Area Calculations
Before diving into code, let's understand the mathematical principles that power our geometry calculator.
The Shoelace Formula for Polygon Area
For calculating the area of any polygon (regular or irregular), we'll use the Shoelace formula, also known as the Surveyor's formula or Gauss's area formula. This powerful algorithm works for any polygon defined by its vertices, regardless of how complex the shape might be.
The formula is expressed as:
Area = 0.5 * |∑(x_i * y_(i+1) - x_(i+1) * y_i)| Where:
x_iandy_iare the coordinates of the i-th vertex- The formula calculates half the sum of the cross products of adjacent vertices
- The absolute value ensures a positive area
This formula works by "walking" around the perimeter of the polygon, calculating cross products between consecutive points. When we sum these up and divide by 2, we get the polygon's area.
Project Setup
Let's start by setting up the basic structure of our geometry calculator:
HTML Structure
Create a new file named index.html with the following structure:
<!DOCTYPE html> <html lang="en"> <head> <meta charset="UTF-8"> <meta name="viewport" content="width=device-width, initial-scale=1.0"> <title>Geometry Area Calculator</title> <link rel="stylesheet" href="styles.css"> </head> <body> <div class="calculator-container"> <h1>Geometry Area Calculator</h1> <div class="input-section"> <h2>Enter Polygon Coordinates</h2> <p>Click on the canvas to add points or enter them manually below.</p> <div class="canvas-container"> <canvas id="polygon-canvas" width="400" height="400"></canvas> <button id="clear-canvas">Clear Canvas</button> </div> <div class="manual-input"> <div class="coordinates-container" id="coordinates-list"> <div class="coordinate-pair"> <input type="number" placeholder="X1" class="x-coord"> <input type="number" placeholder="Y1" class="y-coord"> <button class="remove-point">×</button> </div> </div> <button id="add-point">Add Point</button> </div> <div class="units-selection"> <label for="units">Measurement Units:</label> <select id="units"> <option value="pixels">Pixels</option> <option value="meters">Meters</option> <option value="feet">Feet</option> </select> </div> <button id="calculate-area">Calculate Area</button> </div> <div class="results-section" id="results"> <!-- Results will be displayed here --> </div> </div> <script src="script.js"></script> </body> </html>CSS Styling
Create a file named styles.css for styling our calculator:
* { box-sizing: border-box; margin: 0; padding: 0; font-family: 'Segoe UI', Tahoma, Geneva, Verdana, sans-serif; } body { background-color: #f5f5f5; padding: 20px; } .calculator-container { max-width: 800px; margin: 0 auto; background-color: white; padding: 30px; border-radius: 10px; box-shadow: 0 0 15px rgba(0, 0, 0, 0.1); } h1 { text-align: center; color: #333; margin-bottom: 30px; } h2 { font-size: 1.5rem; margin-bottom: 15px; color: #444; } p { margin-bottom: 20px; color: #666; } .canvas-container { margin-bottom: 30px; text-align: center; } canvas { border: 1px solid #ccc; background-color: #f9f9f9; } .manual-input { margin-bottom: 25px; } .coordinates-container { max-height: 200px; overflow-y: auto; margin-bottom: 15px; } .coordinate-pair { display: flex; margin-bottom: 8px; align-items: center; } input { width: 80px; padding: 8px; margin-right: 10px; border: 1px solid #ccc; border-radius: 4px; } button { padding: 8px 15px; background-color: #4CAF50; color: white; border: none; border-radius: 4px; cursor: pointer; transition: background-color 0.3s; } button:hover { background-color: #45a049; } .remove-point { background-color: #f44336; padding: 8px 12px; } .remove-point:hover { background-color: #d32f2f; } #clear-canvas { margin-top: 10px; } .units-selection { margin-bottom: 25px; } select { padding: 8px; border: 1px solid #ccc; border-radius: 4px; } .results-section { margin-top: 30px; padding: 20px; background-color: #f0f8ff; border-radius: 6px; display: none; } .results-section.active { display: block; } .area-result { font-size: 1.3rem; margin-bottom: 15px; } .calculation-steps { margin-top: 20px; padding: 15px; background-color: #f5f5f5; border-radius: 4px; font-family: monospace; }JavaScript Implementation
Now, let's create the script.js file that will power our geometry area calculator:
// DOM Elements const canvas = document.getElementById('polygon-canvas'); const ctx = canvas.getContext('2d'); const clearCanvasBtn = document.getElementById('clear-canvas'); const addPointBtn = document.getElementById('add-point'); const coordinatesList = document.getElementById('coordinates-list'); const calculateBtn = document.getElementById('calculate-area'); const resultsSection = document.getElementById('results'); const unitsSelect = document.getElementById('units'); // Global Variables let points = []; let isDragging = false; let dragIndex = -1; // Canvas Setup function setupCanvas() { // Set canvas coordinate system (origin at center) ctx.translate(canvas.width / 2, canvas.height / 2); drawGrid(); // Event listeners for canvas interaction canvas.addEventListener('mousedown', handleMouseDown); canvas.addEventListener('mousemove', handleMouseMove); canvas.addEventListener('mouseup', () => isDragging = false); // Redraw canvas initially redrawCanvas(); } // Draw coordinate grid function drawGrid() { const width = canvas.width; const height = canvas.height; ctx.strokeStyle = '#e0e0e0'; ctx.lineWidth = 1; // Vertical lines for (let x = -width/2; x <= width/2; x += 20) { ctx.beginPath(); ctx.moveTo(x, -height/2); ctx.lineTo(x, height/2); ctx.stroke(); } // Horizontal lines for (let y = -height/2; y <= height/2; y += 20) { ctx.beginPath(); ctx.moveTo(-width/2, y); ctx.lineTo(width/2, y); ctx.stroke(); } // X and Y axes (darker) ctx.strokeStyle = '#aaa'; ctx.lineWidth = 2; // X-axis ctx.beginPath(); ctx.moveTo(-width/2, 0); ctx.lineTo(width/2, 0); ctx.stroke(); // Y-axis ctx.beginPath(); ctx.moveTo(0, -height/2); ctx.lineTo(0, height/2); ctx.stroke(); } // Handle mouse down event on canvas function handleMouseDown(e) { const rect = canvas.getBoundingClientRect(); const scaleX = canvas.width / rect.width; const scaleY = canvas.height / rect.height; const canvasX = (e.clientX - rect.left) * scaleX - canvas.width / 2; const canvasY = (e.clientY - rect.top) * scaleY - canvas.height / 2; // Check if clicking near an existing point (for dragging) for (let i = 0; i < points.length; i++) { const dx = points[i].x - canvasX; const dy = points[i].y - canvasY; const distance = Math.sqrt(dx * dx + dy * dy); if (distance < 10) { isDragging = true; dragIndex = i; return; } } // If not dragging, add a new point points.push({x: canvasX, y: canvasY}); updateCoordinateInputs(); redrawCanvas(); } // Handle mouse move event on canvas function handleMouseMove(e) { if (!isDragging || dragIndex === -1) return; const rect = canvas.getBoundingClientRect(); const scaleX = canvas.width / rect.width; const scaleY = canvas.height / rect.height; const canvasX = (e.clientX - rect.left) * scaleX - canvas.width / 2; const canvasY = (e.clientY - rect.top) * scaleY - canvas.height / 2; points[dragIndex] = {x: canvasX, y: canvasY}; updateCoordinateInputs(); redrawCanvas(); } // Redraw the canvas with all points and connections function redrawCanvas() { // Clear the canvas ctx.clearRect(-canvas.width/2, -canvas.height/2, canvas.width, canvas.height); // Redraw the grid drawGrid(); if (points.length === 0) return; // Draw the polygon ctx.beginPath(); ctx.moveTo(points[0].x, points[0].y); for (let i = 1; i < points.length; i++) { ctx.lineTo(points[i].x, points[i].y); } // Connect back to the first point if we have at least 3 points if (points.length >= 3) { ctx.lineTo(points[0].x, points[0].y); // Fill the polygon with a semi-transparent color ctx.fillStyle = 'rgba(76, 175, 80, 0.2)'; ctx.fill(); } // Draw the polygon outline ctx.strokeStyle = '#4CAF50'; ctx.lineWidth = 2; ctx.stroke(); // Draw the points for (let i = 0; i < points.length; i++) { ctx.beginPath(); ctx.arc(points[i].x, points[i].y, 5, 0, Math.PI * 2); ctx.fillStyle = '#4CAF50'; ctx.fill(); // Label the points ctx.fillStyle = '#333'; ctx.font = '12px Arial'; ctx.fillText(`P${i+1}`, points[i].x + 8, points[i].y - 8); } } // Update the coordinate inputs based on canvas points function updateCoordinateInputs() { // Clear all existing inputs coordinatesList.innerHTML = ''; // Add new inputs for each point for (let i = 0; i < points.length; i++) { const pair = document.createElement('div'); pair.className = 'coordinate-pair'; const xInput = document.createElement('input'); xInput.type = 'number'; xInput.className = 'x-coord'; xInput.placeholder = `X${i+1}`; xInput.value = Math.round(points[i].x); xInput.dataset.index = i; const yInput = document.createElement('input'); yInput.type = 'number'; yInput.className = 'y-coord'; yInput.placeholder = `Y${i+1}`; yInput.value = Math.round(points[i].y); yInput.dataset.index = i; const removeBtn = document.createElement('button'); removeBtn.className = 'remove-point'; removeBtn.textContent = '×'; removeBtn.dataset.index = i; pair.appendChild(xInput); pair.appendChild(yInput); pair.appendChild(removeBtn); coordinatesList.appendChild(pair); // Event listeners for manual input changes xInput.addEventListener('change', updatePointFromInput); yInput.addEventListener('change', updatePointFromInput); removeBtn.addEventListener('click', removePoint); } } // Update a point from manual input function updatePointFromInput(e) { const index = parseInt(e.target.dataset.index); const value = parseFloat(e.target.value); if (isNaN(value)) return; if (e.target.className === 'x-coord') { points[index].x = value; } else { points[index].y = value; } redrawCanvas(); } // Remove a point function removePoint(e) { const index = parseInt(e.target.dataset.index); points.splice(index, 1); updateCoordinateInputs(); redrawCanvas(); } // Add a new point via button function addNewPoint() { // Add a new point at (0, 0) or near the last point if one exists if (points.length > 0) { const lastPoint = points[points.length - 1]; points.push({x: lastPoint.x + 20, y: lastPoint.y + 20}); } else { points.push({x: 0, y: 0}); } updateCoordinateInputs(); redrawCanvas(); } // Clear all points function clearCanvas() { points = []; updateCoordinateInputs(); redrawCanvas(); resultsSection.style.display = 'none'; } // Calculate area using the Shoelace formula function calculatePolygonArea(vertices) { if (vertices.length < 3) return 0; let area = 0; const n = vertices.length; for (let i = 0; i < n; i++) { const j = (i + 1) % n; area += vertices[i].x * vertices[j].y; area -= vertices[j].x * vertices[i].y; } return Math.abs(area / 2); } // Display the calculation results function displayResults() { if (points.length < 3) { alert("You need at least 3 points to calculate area."); return; } const area = calculatePolygonArea(points); const selectedUnit = unitsSelect.value; let unitSymbol = 'px²'; let convertedArea = area; // Apply unit conversions if needed if (selectedUnit === 'meters') { unitSymbol = 'm²'; // Assuming 1 pixel = 0.01 meter for example convertedArea = area * 0.0001; } else if (selectedUnit === 'feet') { unitSymbol = 'ft²'; // Assuming 1 pixel = 0.0328 feet convertedArea = area * 0.001; } // Format the result const formattedArea = convertedArea.toFixed(2); // Create the result HTML let resultHTML = ` <h2>Calculation Results</h2> <div class="area-result"> <strong>Polygon Area:</strong> ${formattedArea} ${unitSymbol} </div> <p>Based on ${points.length} vertices</p> <div class="calculation-steps"> <h3>Calculation Steps:</h3> <p>Using the Shoelace formula: A = 0.5 × |∑(xᵢyᵢ₊₁ − xᵢ₊₁yᵢ)|</p> <ol> `; // Add the calculation steps for (let i = 0; i < points.length; i++) { const j = (i + 1) % points.length; const term = (points[i].x * points[j].y - points[j].x * points[i].y).toFixed(2); resultHTML += `<li>Step ${i+1}: (${points[i].x} × ${points[j].y}) - (${points[j].x} × ${points[i].y}) = ${term}</li>`; } resultHTML += ` </ol> <p>Summing all steps and taking absolute value: ${Math.abs(area).toFixed(2)}</p> <p>Dividing by 2: ${(Math.abs(area)/2).toFixed(2)}</p> </div> `; resultsSection.innerHTML = resultHTML; resultsSection.style.display = 'block'; resultsSection.scrollIntoView({ behavior: 'smooth' }); } // Initialize the application function init() { setupCanvas(); // Event listeners clearCanvasBtn.addEventListener('click', clearCanvas); addPointBtn.addEventListener('click', addNewPoint); calculateBtn.addEventListener('click', displayResults); } // Start the app when the page loads window.addEventListener('load', init);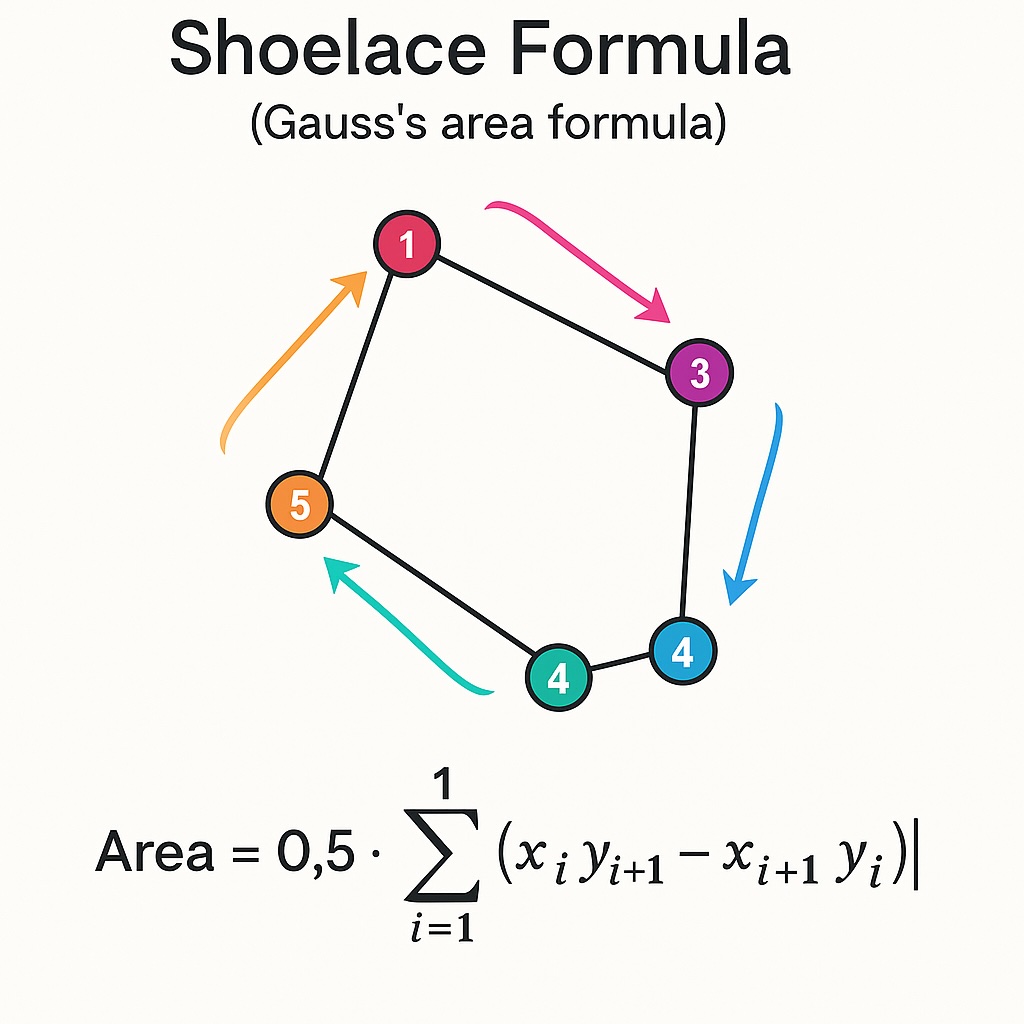
Visual representation of how the Shoelace formula calculates the area of a polygon
Understanding the Key Components
Let's break down the major components of our geometry area calculator:
Canvas Interaction
Our calculator uses an HTML Canvas element for interactive polygon creation. Users can:
- Click on the canvas to add points
- Drag existing points to adjust positions
- See real-time visualization of the polygon
- View a coordinate grid for reference
The canvas is set up with a coordinate system where (0,0) is at the center, making it intuitive for users to work with both positive and negative coordinates.
Coordinate Input Management
Users can input coordinates in two ways:
- Visual input: Click directly on the canvas to place points
- Manual input: Enter exact coordinates in the input fields
The two input methods are synchronized, allowing for both intuitive visual placement and precise numerical input.
The Shoelace Algorithm Implementation
The core of our calculator is the implementation of the Shoelace formula:
function calculatePolygonArea(vertices) { if (vertices.length < 3) return 0; let area = 0; const n = vertices.length; for (let i = 0; i < n; i++) { const j = (i + 1) % n; area += vertices[i].x * vertices[j].y; area -= vertices[j].x * vertices[i].y; } return Math.abs(area / 2); }This function:
- Takes an array of vertex coordinates
- Loops through each point and the next point (wrapping around to the first point)
- Applies the cross-product calculation
- Takes the absolute value and divides by 2 to get the final area
The beauty of this algorithm is that it works for any polygon, regardless of whether it's convex or concave, as long as it doesn't intersect itself.
Adding Advanced Features
Now that we have the basic calculator working, let's extend it with some advanced features:
Unit Conversion
Our calculator supports different units of measurement:
- Pixels: For screen-based measurements
- Meters: For real-world metric measurements
- Feet: For imperial measurements
The unit conversion is applied after the area calculation:
// Apply unit conversions if needed if (selectedUnit === 'meters') { unitSymbol = 'm²'; // Assuming 1 pixel = 0.01 meter for example convertedArea = area * 0.0001; } else if (selectedUnit === 'feet') { unitSymbol = 'ft²'; // Assuming 1 pixel = 0.0328 feet convertedArea = area * 0.001; }You can customize the conversion factors based on your specific requirements.
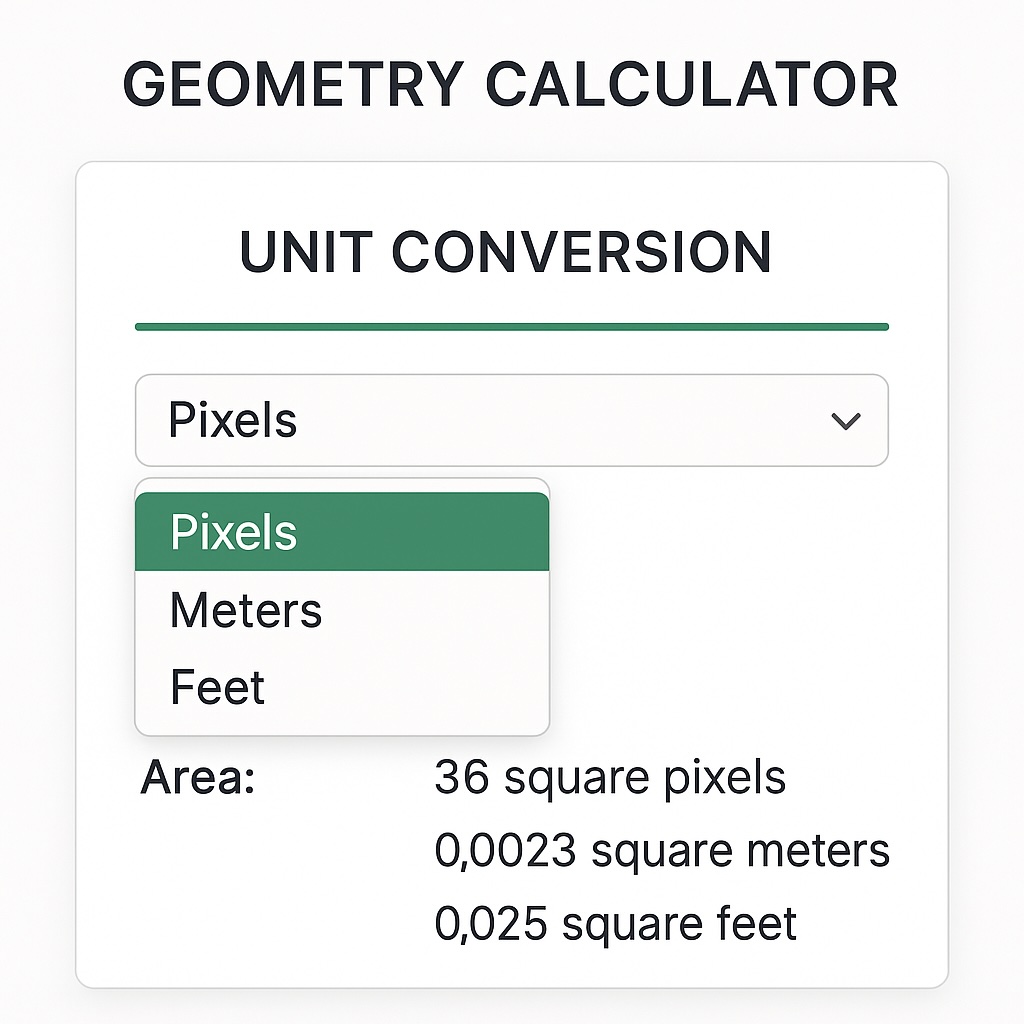
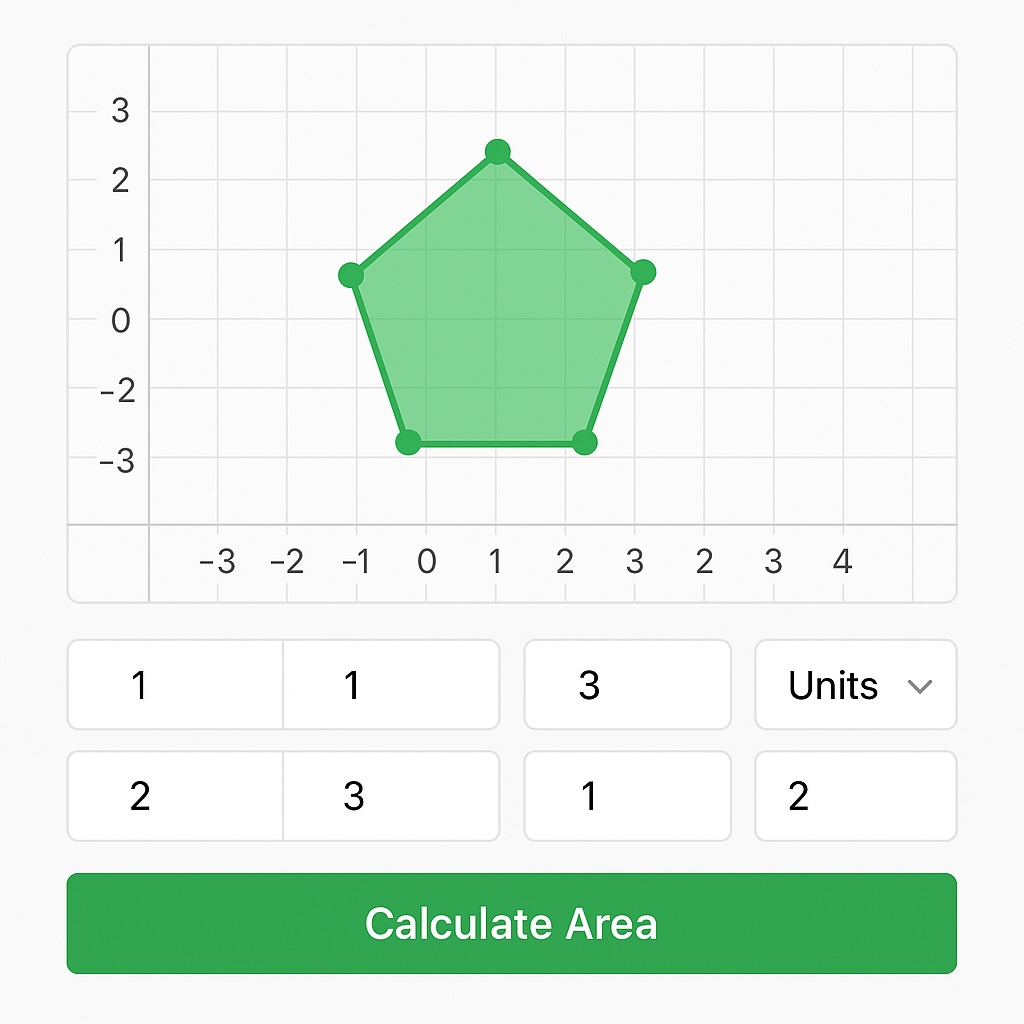
The calculator interface showing unit conversion options for different measurement systems
Detailed Calculation Steps
To help users understand how the area is calculated, we provide a detailed breakdown of the calculation steps:
// Add the calculation steps for (let i = 0; i < points.length; i++) { const j = (i + 1) % points.length; const term = (points[i].x * points[j].y - points[j].x * points[i].y).toFixed(2); resultHTML += `<li>Step ${i+1}: (${points[i].x} × ${points[j].y}) - (${points[j].x} × ${points[i].y}) = ${term}</li>`; }This transparency helps users verify the results and learn about the mathematical principles behind polygon area calculations.
Testing and Validation
Before considering our geometry calculator complete, let's test it with some known shapes to verify its accuracy:
Test Case 1: Rectangle
A simple rectangle with vertices at (0,0), (100,0), (100,50), and (0,50) should have an area of 5,000 square units.
Test Case 2: Triangle
A triangle with vertices at (0,0), (50,100), and (100,0) should have an area of 5,000 square units.
Test Case 3: Irregular Polygon
An irregular polygon with vertices at (0,0), (50,100), (100,50), (75,25), and (25,25) should give us the correct area based on the Shoelace formula.
For each test case, our calculator should:
- Allow easy input of the test coordinates
- Calculate the correct area
- Display the calculation steps for verification
Optimizing for Mobile Devices
To make our geometry calculator fully responsive, we can add the following enhancements:
- Touch support for canvas interaction
- Responsive layout that adapts to different screen sizes
- Simplified interface for smaller screens
These additions ensure our calculator is usable on smartphones and tablets, making it accessible to users across all devices.
Additional Enhancements
To make our geometry area calculator even more robust, consider implementing these additional features:
Preset Shapes
Add buttons to quickly create common shapes like:
- Square
- Rectangle
- Triangle
- Circle (approximated as a regular polygon)
- Regular polygons (pentagon, hexagon, etc.)
Area Calculation for Circles
Extend the calculator to handle circle areas using:
function calculateCircleArea(radius) { return Math.PI * radius * radius; }Perimeter Calculation
Add functionality to calculate the perimeter of polygons:
function calculatePolygonPerimeter(vertices) { let perimeter = 0; const n = vertices.length; for (let i = 0; i < n; i++) { const j = (i + 1) % n; const dx = vertices[j].x - vertices[i].x; const dy = vertices[j].y - vertices[i].y; perimeter += Math.sqrt(dx * dx + dy * dy); } return perimeter; }Saving and Loading Polygons
Implement localStorage to save and load polygon configurations:
// Save polygon function savePolygon(name) { const polygonData = JSON.stringify(points); localStorage.setItem(`polygon_${name}`, polygonData); } // Load polygon function loadPolygon(name) { const polygonData = localStorage.getItem(`polygon_${name}`); if (polygonData) { points = JSON.parse(polygonData); updateCoordinateInputs(); redrawCanvas(); } }Practical Applications
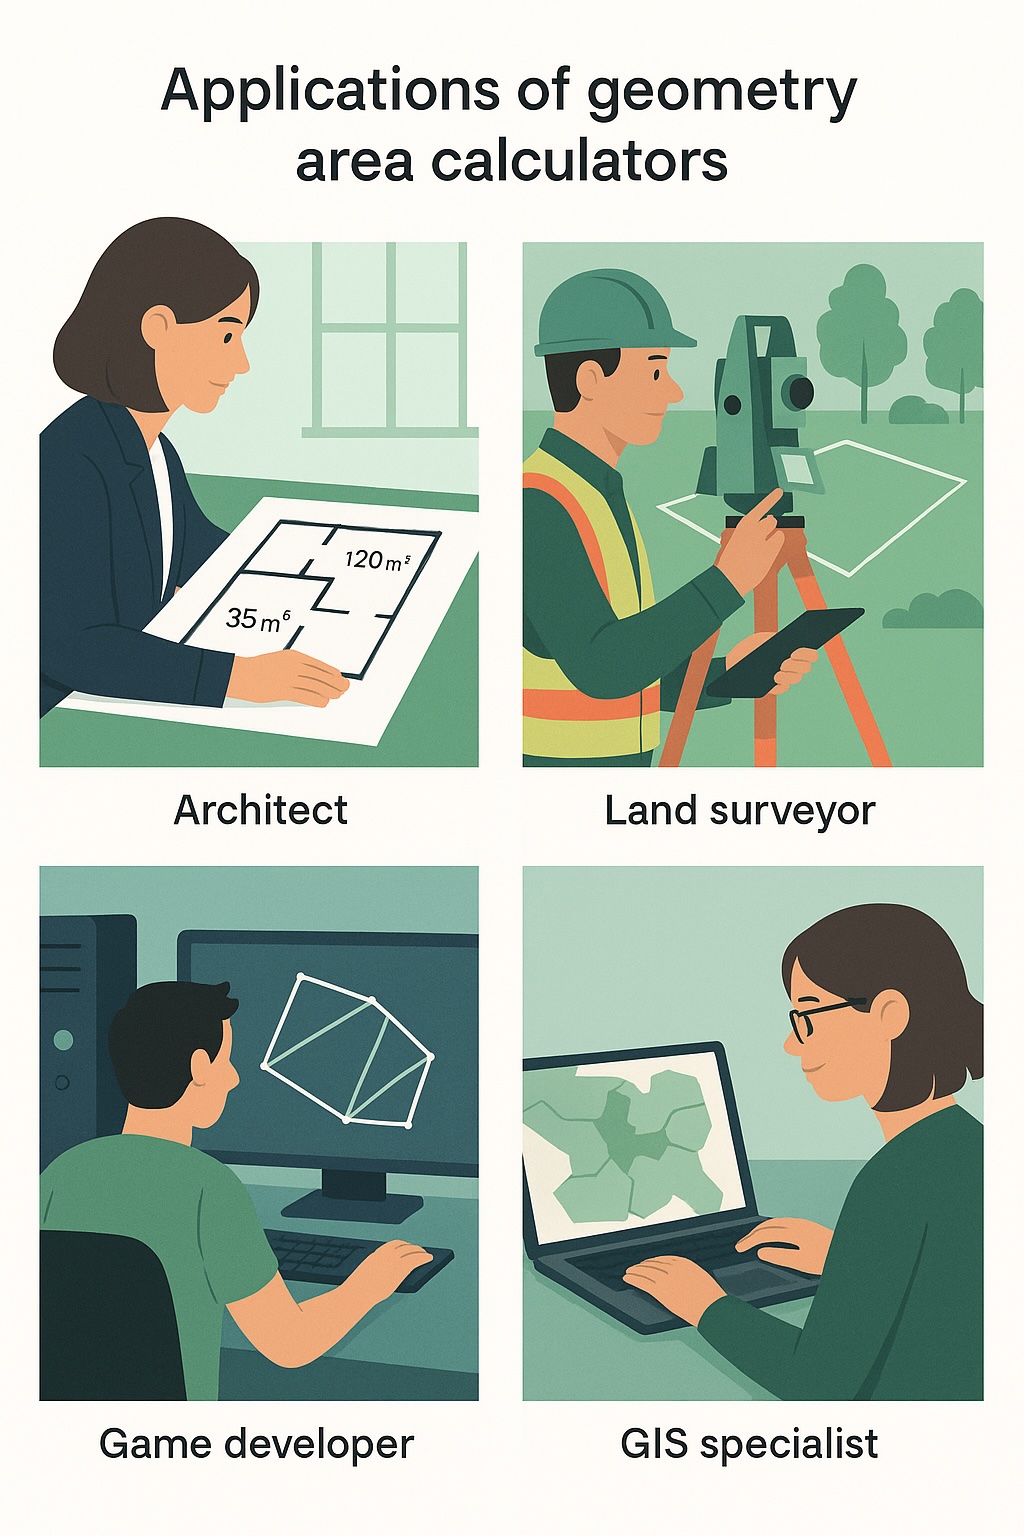
Various real-world applications where geometry area calculators provide valuable solutions
Our JavaScript geometry area calculator has numerous practical applications:
Web Development
- Interactive maps and plot visualizations
- Land surveying applications
- Real estate planning tools
- Room layout and design applications
Education
- Teaching geometric principles interactively
- Visualizing mathematical concepts
- Creating interactive learning resources
Game Development
- Collision detection for game objects
- Level design and environment creation
- Procedural generation of game worlds
Conclusion
In this comprehensive tutorial, we've built a powerful, interactive geometry area calculator using JavaScript. Our calculator can:
- Accurately calculate the area of any polygon using the Shoelace formula
- Provide an intuitive visual interface for creating and modifying shapes
- Support manual coordinate input for precise measurements
- Convert between different units of measurement
- Show detailed calculation steps for educational purposes
The principles and techniques we've covered—coordinate geometry, the Shoelace algorithm, canvas manipulation, and user interface design—are valuable skills that extend beyond this specific project. You can apply them to various web development challenges, from data visualization to interactive applications.
By building this geometry calculator, you've not only created a useful tool but also deepened your understanding of mathematical concepts and their implementation in JavaScript. Feel free to extend the calculator with additional features, optimize its performance, or integrate it into your own projects.
Happy coding!